 davidforse.com
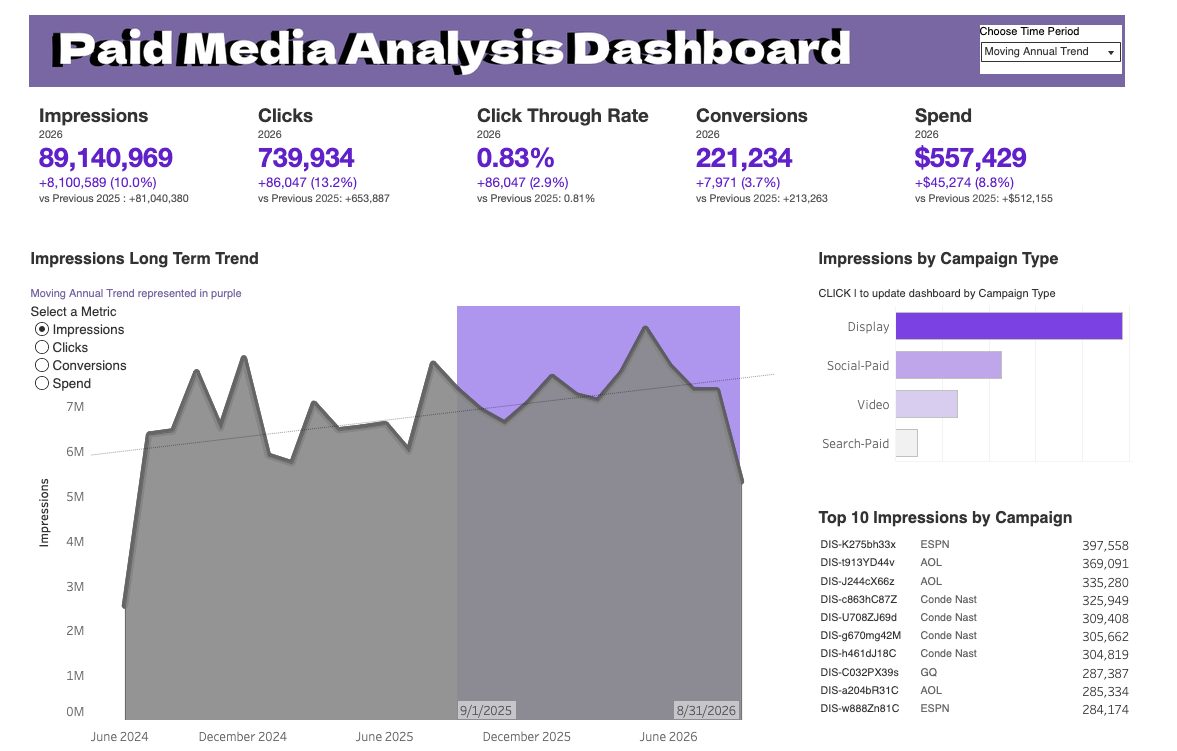
Paid Media Analysis Dashboard
If you're running paid media spend across multiple channels and publishers, this dashboard puts
your entire performance story in front of you the moment you open it — no digging through
separate platform logins, no manual exports. You get Impressions, Clicks, CTR, Conversions, and
Spend all in one glance, each one showing exactly how you're trending against last year, so you
walk into any budget conversation already knowing whether you're ahead or behind before anyone
asks.
What makes this genuinely useful day-to-day is the trend view: you can flip between Impressions,
Clicks, Conversions, or Spend with a single click and instantly see the moving annual trend
highlighted against your full history. That means you're not just seeing a number — you're
seeing whether that number is part of a real pattern or a one-off spike, which is exactly the
kind of judgment call this tool helps you make faster and with more confidence.
And when it's time to defend or reallocate budget, you don't need a second report — the Campaign
Type breakdown and Top 10 Campaigns table tell you precisely where your impressions are
concentrated, down to the individual campaign and publisher. This is a tool built to save you
hours of manual reporting every month while giving you a sharper, more current view than a
static spreadsheet ever could.
Features
Instantly know if you're ahead or behind last year on every KPI, with exact percentage and dollar deltas.
Spot seasonal patterns and momentum shifts at a glance with the highlighted current-period trend.
Break down performance instantly by campaign type (Display, Social, Video, Search) with one click.
Process
details on how the project was made
Background
During my work I had the pleasure to work in the marketing space. I was struck by how much data was flowing through that they needed to make decisions on. Many different campains, mediums, metrics - how can they keep it all in their head(❗)
I had a big idea for creating a suite of dashboards based on marketing, sales, operations, and then how to follow up with the customers and tracking next steps strategies, but I was hired soon after I finished the first piece this dashboard.
Methodology
The big challenge for this dashboard was the initial data creation. As stated previously I hoped to create a suite of dashboards I wanted to future proof the data for the subsequent Sales, operations, and sales retention dashboards. Given that ambition I wanted customer data that extended out for many years (to calculate survial analysis). So within the data there is the initial campain that created the initial relationship with the customer and then the subsequent relationship over many years. Looking back over my notes it was quite ambitious(❗). So within each of the thousands of campaigns is significant meta data that I could power the future analysis.
The marketing data uses industry standard cost rates as well as published conversion rates, with each campaign randomized to come up with the final outcome.
Data
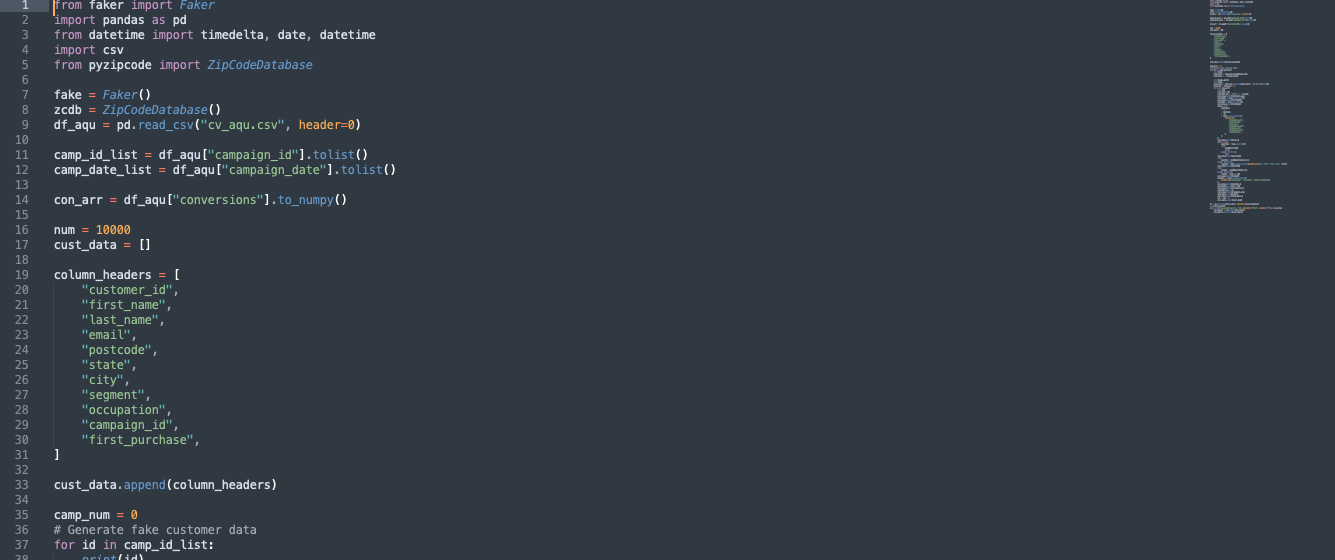 The data was created from python using faker. I wanted some customer specific information that I
wasn't really seeing on available customer data sets...so
I created my own
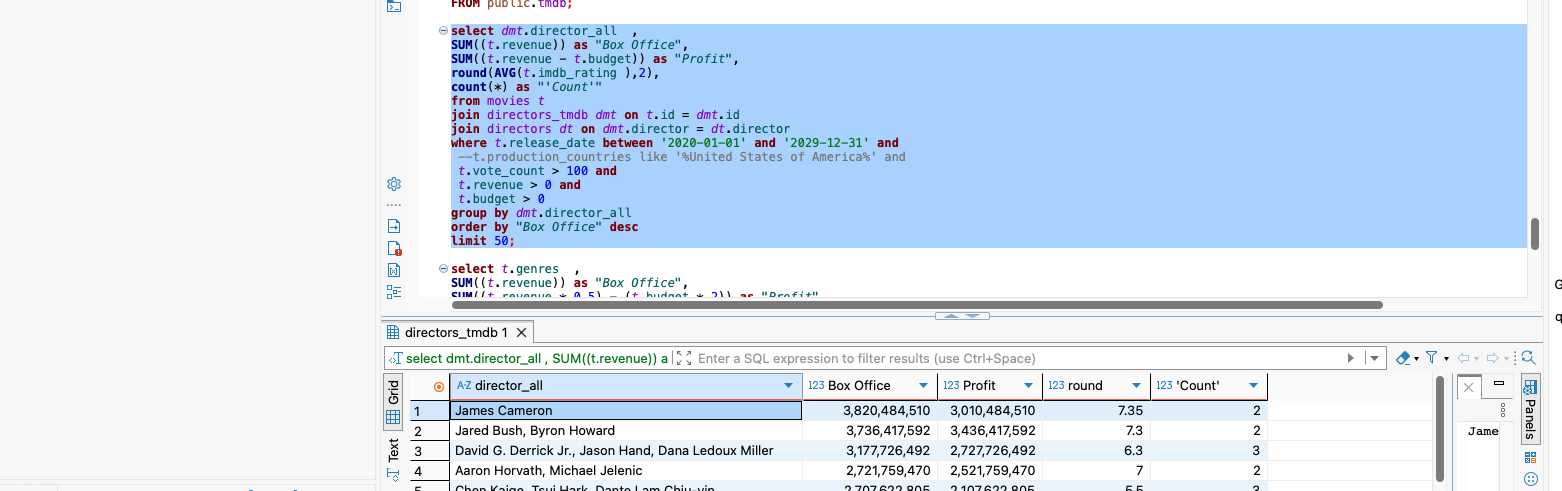 uploaded to a local PostgreSQL database.
Visual
The dashboard was done in Tableau and the first publicly avaiable dashboard I used image editing software in my work. There are elements I like in this dashboard, but I think I may update at some point.