 davidforse.com
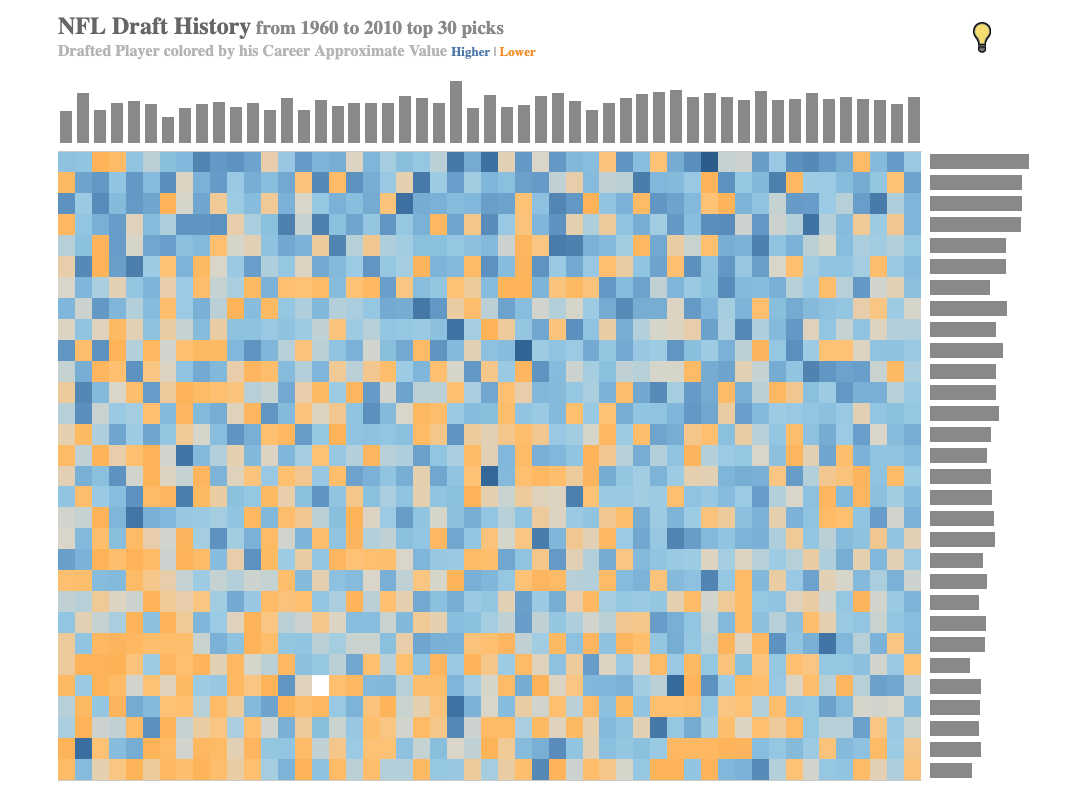
NFL Draft History (1960–2010, Top 30 Picks)
If you're a scout, analyst, front-office decision-maker, or just a die-hard fan who wants a
genuinely new way to see fifty years of NFL draft history, this tool gives you something no
spreadsheet or article ever could: an instant visual read on which draft classes and pick ranges
actually delivered value, and which didn't. One glance at the color pattern and you can spot
entire eras of strong or weak drafting without reading a single number.
This isn't just a novelty — it's a legitimately useful research tool. Because every pick from
1960 to 2010 is plotted by career Approximate Value, you can quickly answer real questions: were
early first-round picks in a given decade more reliable than later ones? Did certain draft years
age better than others? The supporting bar charts along the edges add distribution context, so
you're never just eyeballing color — you've got real structure backing up what you're seeing.
And because it's interactive, this rewards exploration rather than a one-time read. You can
hover in and get details on individual picks, letting you go from big-picture pattern to
specific-player detail in seconds. It's the kind of visualization that turns a "trust me, I've
watched a lot of football" argument into something you can actually show someone.
Features
Pattern recognition at a glance — spot strong and weak draft classes instantly
Built for research and storytelling alike — scouting, media, or fan debate
Visually distinctive design that holds attention longer than a standard stat table
Process
details on how the project was made
Background
I've long been facinated by the NFL Draft and how to build a successful team. Draft the right players and you can have a successful team for years to come, draft poorly and you can suffer in the fan doldrums for years. Once I saw all the great nfl data online I knew I needed to get my hands on the draft information.
Methodology
Comparing players in the NFL can be difficult, the quarterback is much more impactful than other positions. So how can you fairly compare a quarterback to a wide receiver or a defensive player? Fortunately, there are advanced metrics and analytics that help level the playing field. Once you account for these factors, you can isolate the true value of each player and compare draft picks across different positions and different seasons more effectively.
The next challenge is how to visualize and present this data in a way that makes it easy to understand and compare draft picks across 50 years of NFL history.
Data
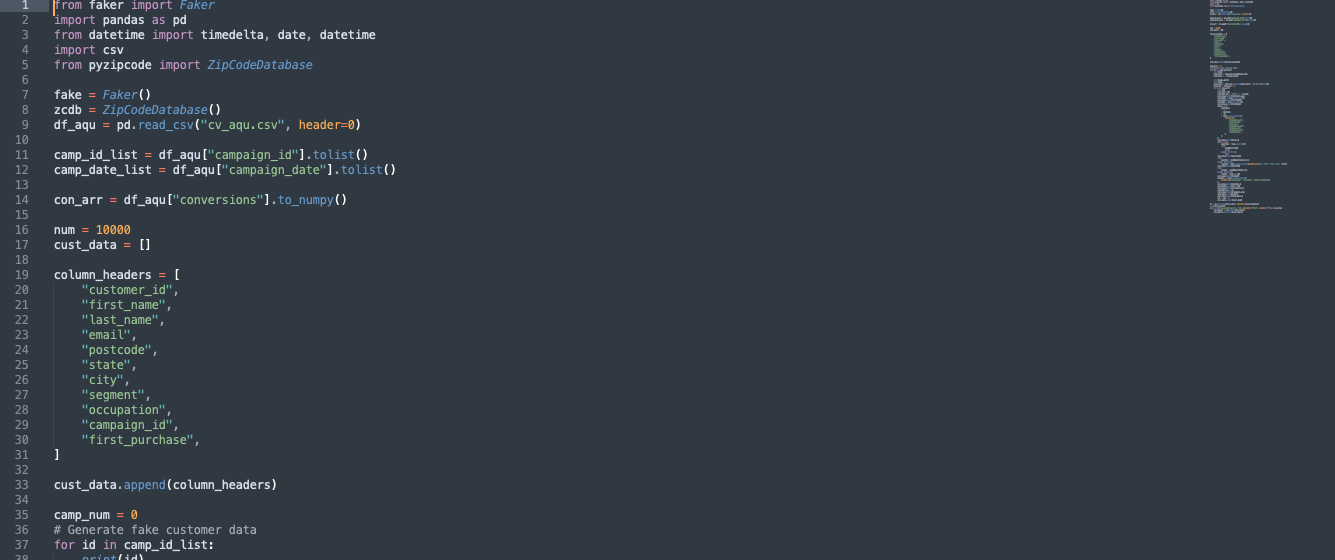 The data was created from python using beautifulsoup to find information from various NFL
websites.
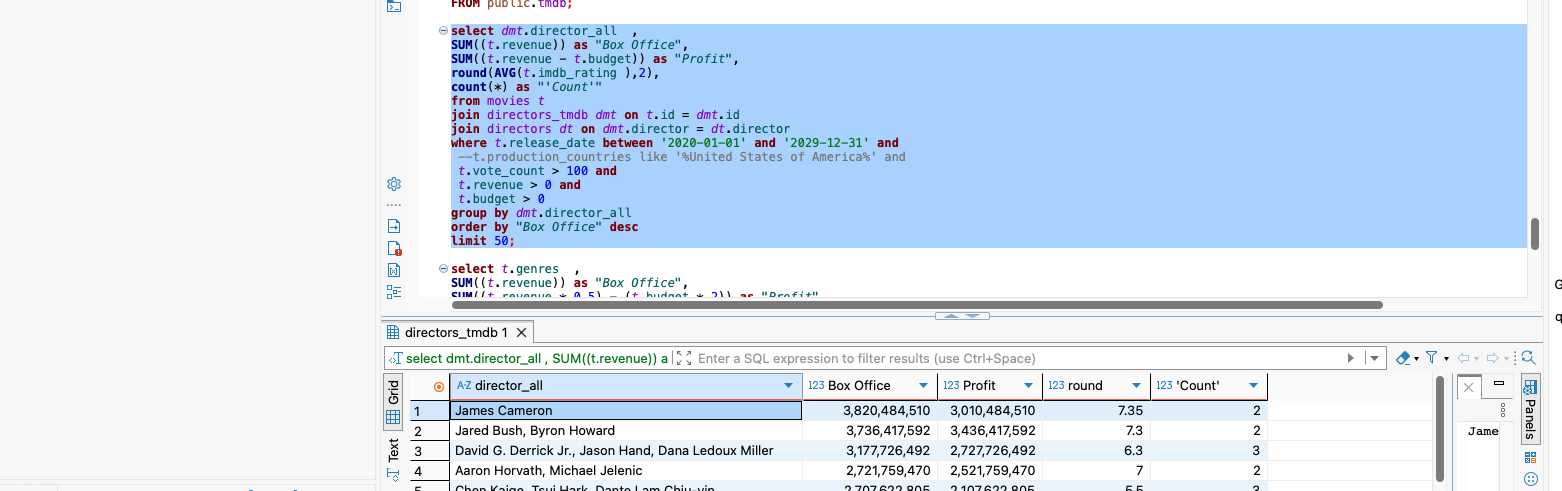 uploaded to a local PostgreSQL database.
Visual
The visual I believe helps to clearly show the relationships and trends in the NFL draft data over the years. Simple to understand and interpret. Yet quickly shows the best and worst years, displaying a considerable amount of information at a glance. Check it out and let me know what you think!