 davidforse.com
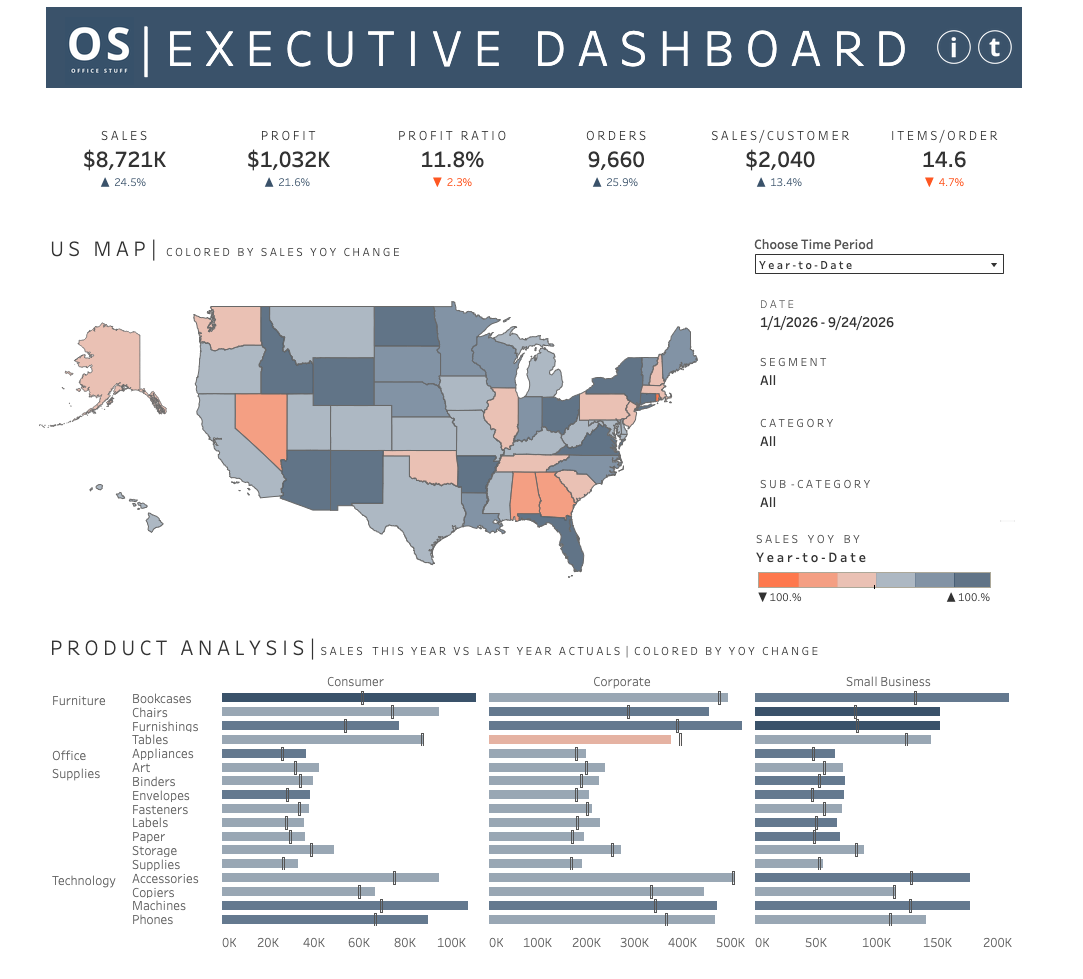
Executive Dashboard (OS – Office Stuff)
If you're an executive who needs the full health of the business in one screen — sales,
profitability, regional performance, and product-line detail — without waiting on a weekly
report from your analytics team, this is that dashboard. Six core KPIs greet you the second it
loads: Sales, Profit, Profit Ratio, Orders, Sales per Customer, and Items per Order, each
showing exactly how you're trending. You know where you stand before you've even scrolled.
From there, the US map lets you see state-by-state performance instantly, color-coded so you can
spot a struggling region — like Nevada or Alabama here — without hunting through a table. And
because the filters for Segment, Category, and Sub-Category sit right next to the map, you can
slice into any question that comes up in the room in real time, live, in front of whoever you're
presenting to.
The Product Analysis section is where this dashboard really pays for itself: Consumer,
Corporate, and Small Business performance side-by-side, broken all the way down to individual
product lines, with last year's numbers built right into every bar. That means when someone asks
"how's Corporate doing on Copiers versus last year," you're not promising to follow up — you
already have the answer, on screen, in seconds.
Features
Six core business KPIs — Sales, Profit, Profit Ratio, Orders, Sales/Customer, Items/Order
State-by-state US map colored by year-over-year sales performance
Answers follow-up questions in real time — no "I'll get back to you" needed
Process
details on how the project was made
Background
The beginning of my professional experience was maintaining an executive dashboard made by my friend and mentor Anna K (thanks Anna!). Anna's dashboard was produced in tableau, drew from a dynamics ERP SQL server and an access database - for finance people to input budgeting information. The dashboard updated every 15 minutes(❗) and was expertly constructed by Anna. Mainting that dashboard was the backbone experience of my current career.
In honor of that experience, I wanted to create my own version resulting in the now outdated old executive dashboard
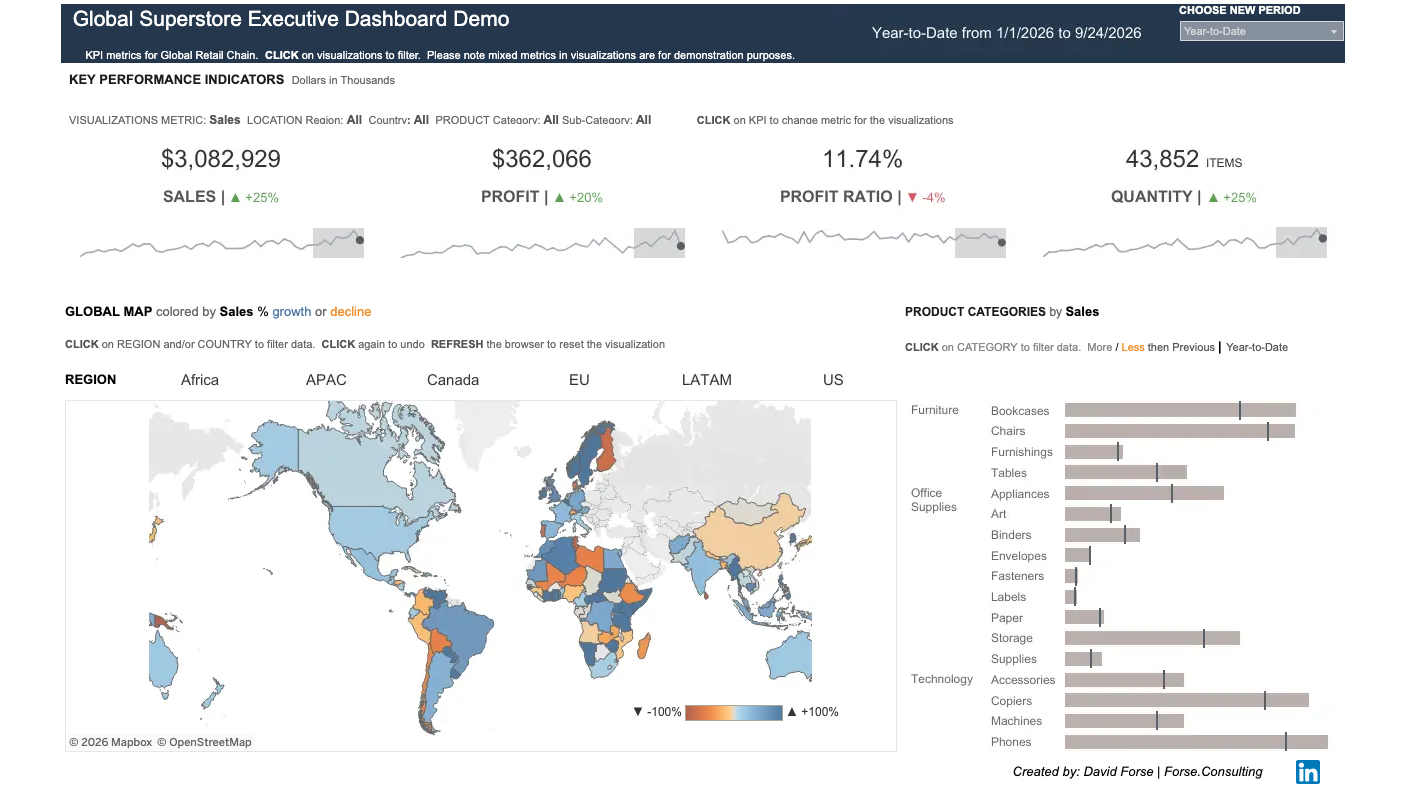 I built this first version in 2018(❓)
A few years back I wanted to see the difference in my advancing style over the years, which
resulted in
the following:
Its been a few years since the last one and there are some further updates to my style. A new
version
tbd...
Methodology
When thinking about an executive and their relationship to data I usually default to the idea that they are smart people with limited amounts of time and understanding of data. So it is incumbent upon the developer to design in a way that directly address the most important questions, is easy to undertand and intuitive to use, which can be easier said than done.
To that end I like to make easy to understand overall metrics, geography and products - color coated in in oranges and blues to easily find problem areas and quickly find areas of success.
Data
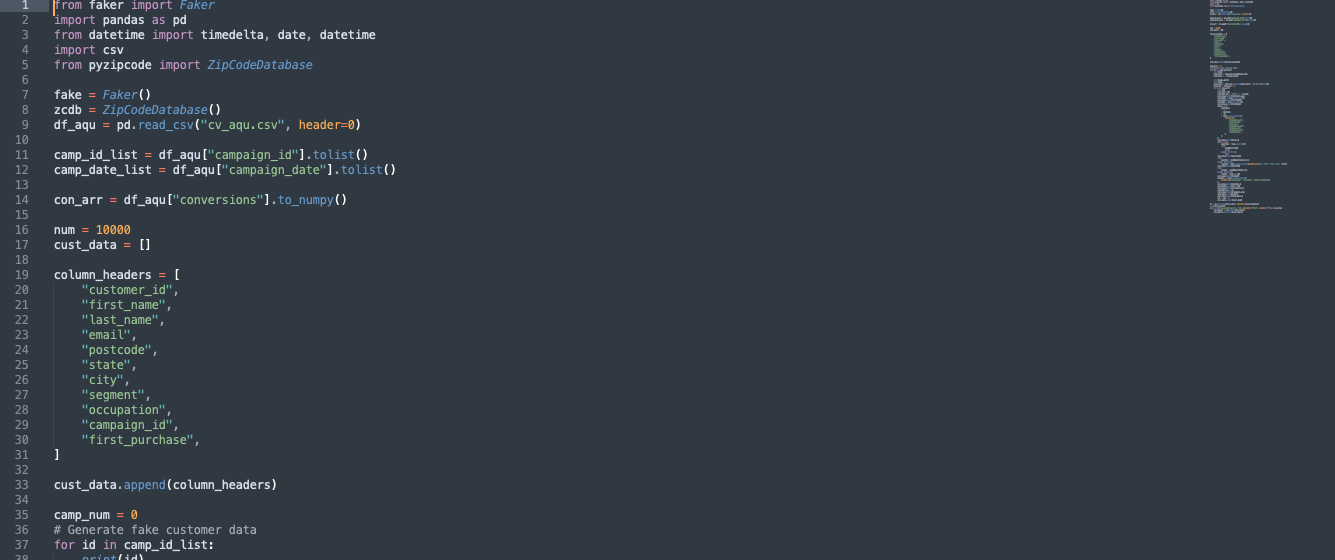 The data was created from python using faker. I wanted some customer specific information that
wasn't provided by the Tableau Superstore data set...so I created my own
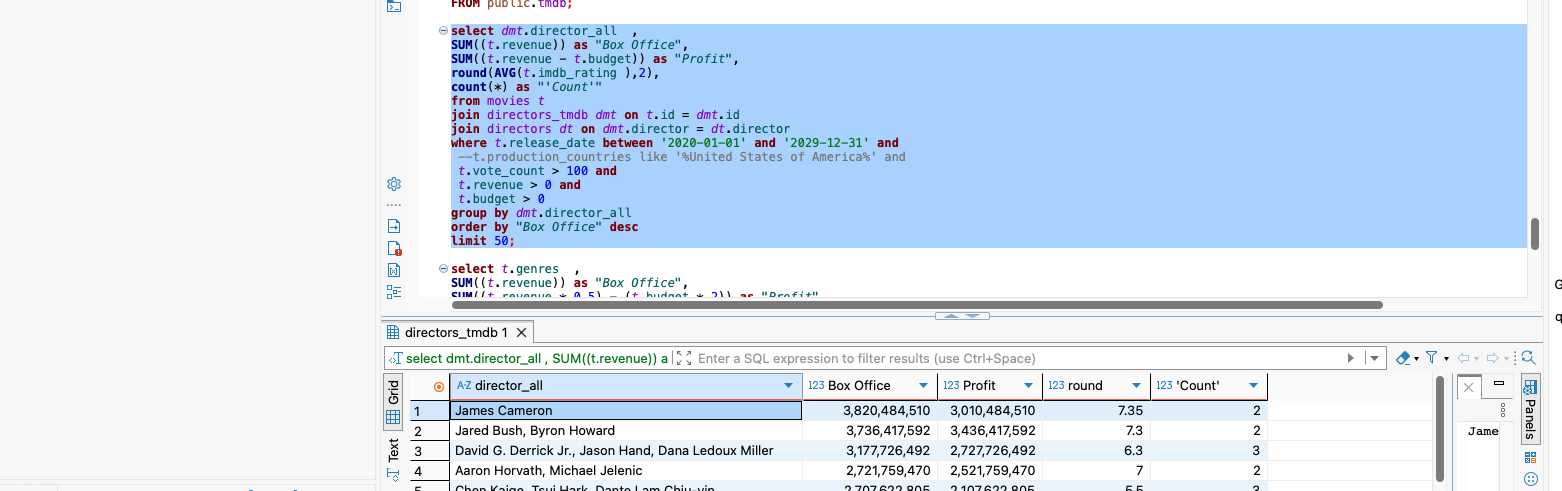 uploaded to a local PostgreSQL database. Then transformed into sql to then visualize in Tableau
Visual
The visual is designed to be used by a smart-hurried executive to at a glance understand the health of his/her business and the ability to easily dig deeper if needed. The dashboard sits in Tableau public, I hope you check it out soon.