 davidforse.com
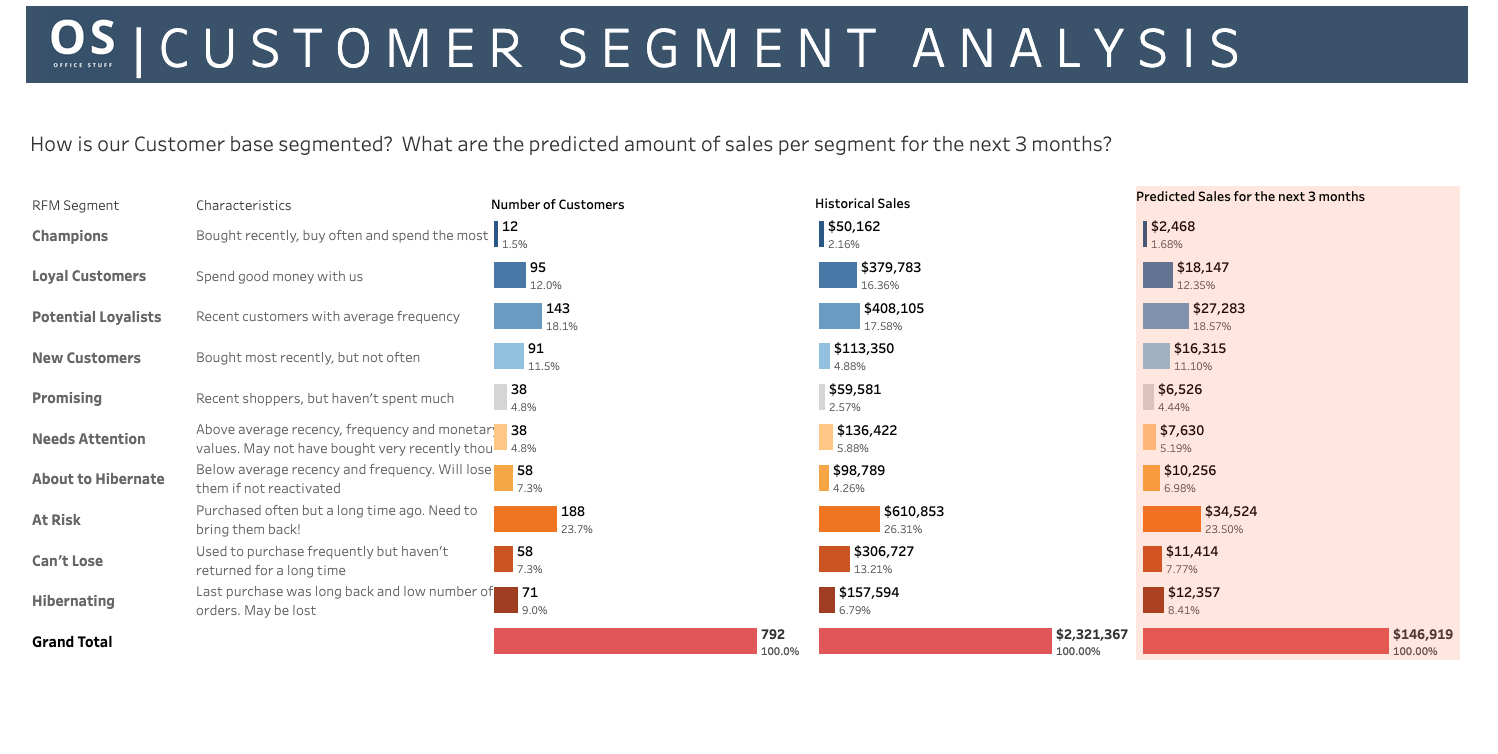
Customer Segment Analysis (RFM)
If you're running retention, lifecycle marketing, or CRM strategy, this dashboard hands you
something most teams have to hire a data science consultant to build: a full RFM segmentation of
your customer base, in plain English, with a forward-looking sales forecast attached. You don't
need to understand the statistics behind Recency, Frequency, and Monetary scoring — the
"Characteristics" column tells you exactly what each segment means and what action it calls for.
This is built to drive decisions, not just describe your customers. See at a glance that your
"At Risk" segment represents nearly a quarter of your customer base and over a quarter of
historical sales — that's an immediate, dollar-quantified case for a win-back campaign, and you
don't have to build that case yourself; the dashboard already has. The color coding does the
prioritization work for you: warm colors flag the segments that need attention now, cool colors
show you who's already healthy.
And the forward-looking "Predicted Sales for the next 3 months" column is what elevates this
from a nice-to-have report to a genuine planning tool — you're not just looking backward at what
happened, you're getting a forecast you can actually budget and staff against. Hand this
straight to your marketing or CRM team and they can start building campaigns off it the same
day.
Features
Full customer base segmentation — 11 defined RFM segments, zero data science needed
Plain-English segment definitions built directly into the table
3-month forward sales forecast by segment — a true planning tool, not just a report
Process
details on how the project was made
Background
Methodology
To find the answers I looked to Peter Faders guidence, specifically this work 📖 he did with Bruce Hardie and Ka Lok Lee. I was able to translate their work to the data using python, sql and finishing the visualization with Tableau.
Data
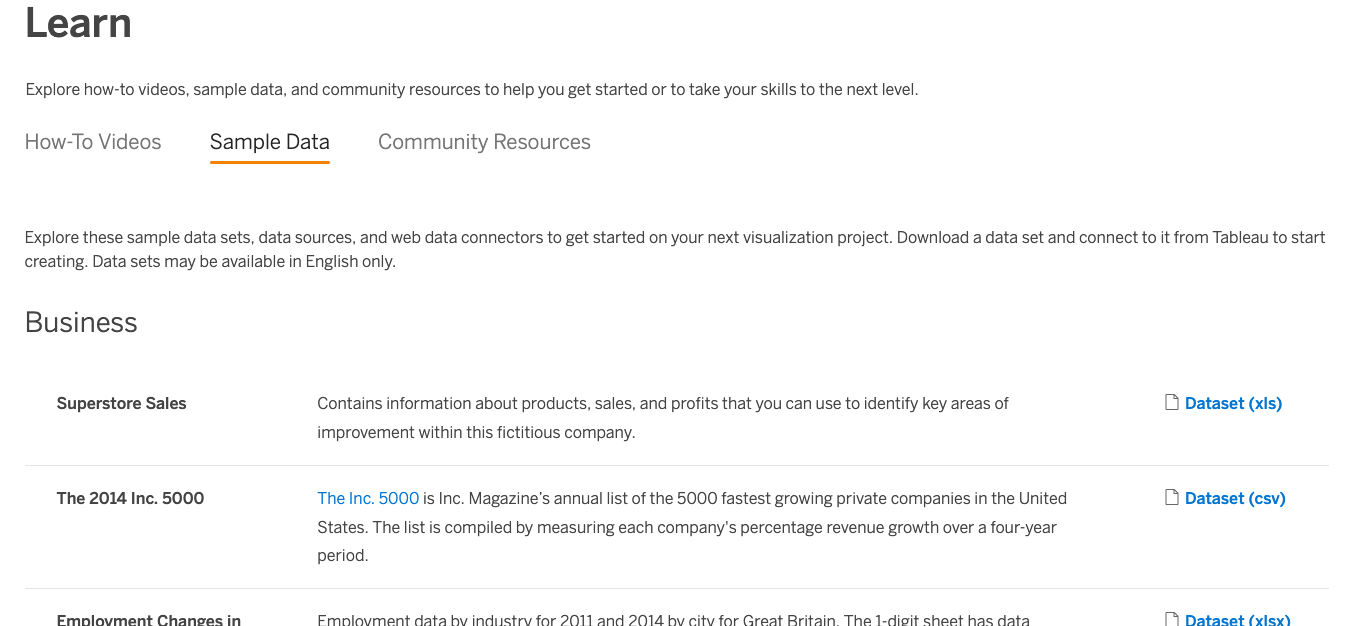 the data is from Tableau - using the Superstore Sales dataset.
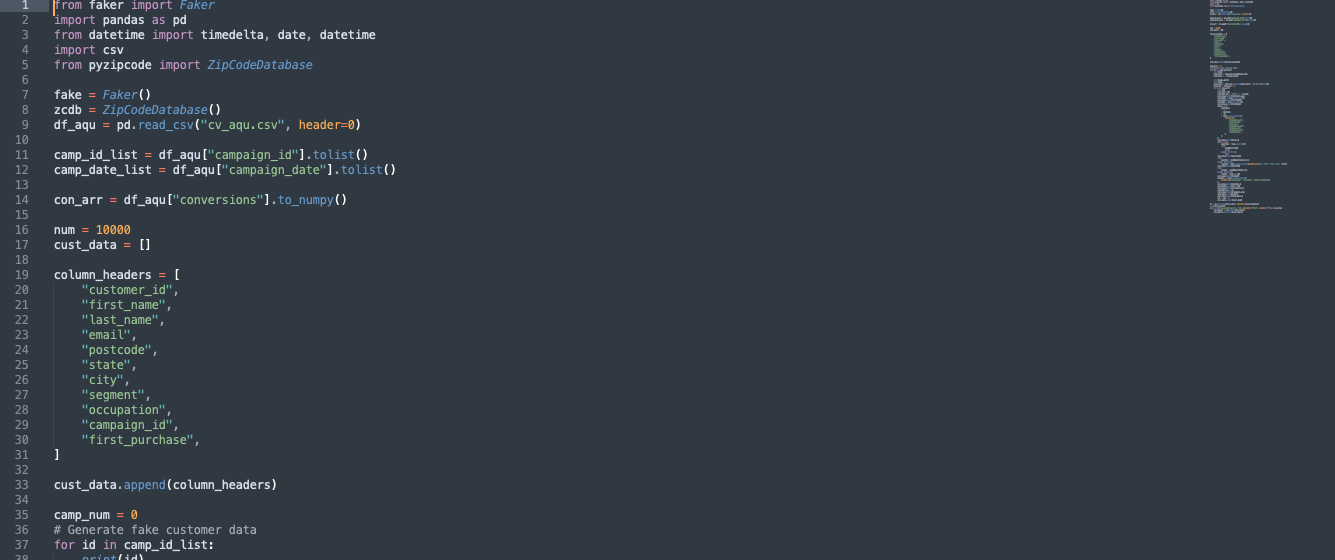 The data was then transformed in python to separate the recency, frequency, and monetary value.
To find the estimated lifetime value I used a gamma gamma model.
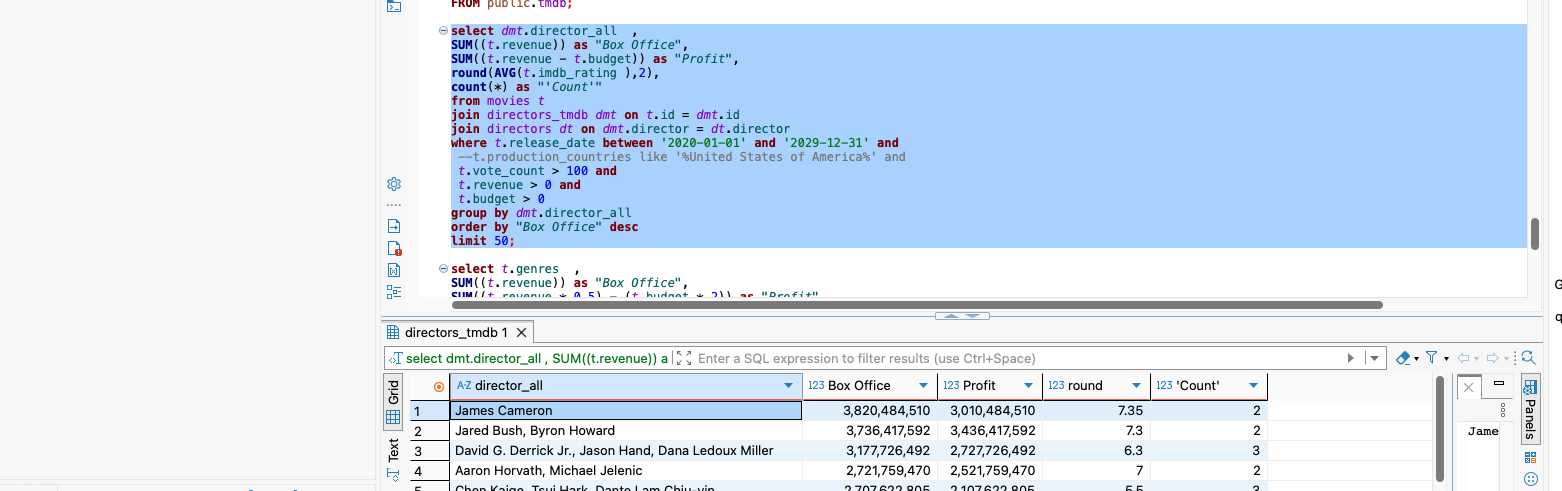 uploaded to a local PostgreSQL database. Then transformed in sql to visualize in Tableau
Visual
The key for the visual was to make the visual easy for the end user to consume and at a glance see who the best customer were. It also makes it easy to segment which customers need to have resources spent in their direction to recieve the maximum value in return. Take a look at the analysis below and let me know if you have any questions.